Download: https://osdyn.ifremer.fr/pyweb/notebooks/utils/plot/colorbar.ipynb
colorbars
How to specify the levels of a colorbar ?
[1]:
import matplotlib as mpl
import matplotlib.pyplot as plt

from osdyn.config import data_sample
from osdyn.grcm.generic import moawi
from osdyn.utils.plot.colorbar import auto_scale, histo
from osdyn.utils.plot.colormap import get_cmap
[2]:
mc = moawi(data_sample("mars_siggen.nc"), model="mars", varnames=["temp_sfc", "temp_bot"])
var = mc.ds.temp_bot
Found 1 files
[WARNING]:  cf.py in name2key - line: 1288
 No osdyn key for this variable : sc_w
[WARNING]:  cf.py in name2key - line: 1288
 No osdyn key for this variable : sc_t
[3]:
mc.ds
[3]:
<xarray.Dataset>
Dimensions:   (nz_g: 41, nz_c: 40, nt: 3, ny_c: 33, nx_c: 33, nx_g: 33, ny_g: 33)
Coordinates:
  * nz_g      (nz_g) float64 0.5 1.5 2.5 3.5 4.5 ... 36.5 37.5 38.5 39.5 40.5
  * nz_c      (nz_c) float64 1.0 2.0 3.0 4.0 5.0 ... 36.0 37.0 38.0 39.0 40.0
  * nt        (nt) int64 0 1 2
    lat_t     (ny_c, nx_c) float64 47.64 47.64 47.64 47.64 ... 49.08 49.08 49.08
    lon_t     (ny_c, nx_c) float64 -6.249 -6.182 -6.115 ... -4.237 -4.17 -4.102
  * nx_c      (nx_c) float32 1.0 11.0 21.0 31.0 41.0 ... 291.0 301.0 311.0 321.0
  * ny_c      (ny_c) float32 1.0 11.0 21.0 31.0 41.0 ... 291.0 301.0 311.0 321.0
    time      (nt) float64 3.524e+09 3.524e+09 3.524e+09
  * nx_g      (nx_g) float32 1.5 11.5 21.5 31.5 41.5 ... 291.5 301.5 311.5 321.5
  * ny_g      (ny_g) float32 1.5 11.5 21.5 31.5 41.5 ... 291.5 301.5 311.5 321.5
    sc_t      (nz_c) float32 -0.9875 -0.9625 -0.9375 ... -0.0625 -0.0375 -0.0125
    sc_w      (nz_g) float32 -1.0 -0.975 -0.95 -0.925 ... -0.05 -0.025 0.0
Data variables:
    h_t       (ny_c, nx_c) float32 -152.0 -159.6 -150.8 ... -95.97 -90.55 -92.11
    theta     float64 6.0
    b         float64 0.0
    sc_cs_t   (nz_c) float32 -0.9277 -0.7985 -0.6873 ... -0.001125 -0.0003722
    sc_cs_w   (nz_g) float32 -1.0 -0.8607 -0.7408 ... -0.00151 -0.0007464 0.0
    hc        (ny_c, nx_c) float32 9.0 9.0 9.0 9.0 9.0 ... 9.0 9.0 9.0 9.0 9.0
    temp_sfc  (nt, ny_c, nx_c) float32 nan nan nan nan ... 14.56 14.67 14.72
    temp_bot  (nt, ny_c, nx_c) float32 nan nan nan nan ... 14.54 14.63 14.71
Attributes:
model: MarsClassic quick search
The data are used to get the minimum and maximum values
[4]:
scale = auto_scale(var)
scale
[4]:
array([11., 12., 13., 14., 15., 16., 17., 18.])
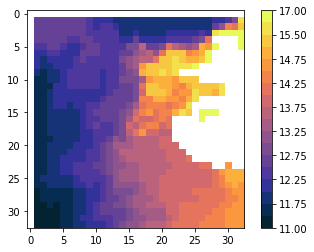
[5]:
def plot(scale):
    cmap = get_cmap("cmo.thermal")
    norm = mpl.colors.BoundaryNorm(scale, ncolors=cmap.N, clip=True)
    plt.figure()
    c = plt.imshow(var[-1,...], cmap="cmo.thermal", norm=norm)
    # plt.contour(mc.ds.temp_sfc.values[-1,...], cmap='cmo.thermal', levels=scale)
    plt.colorbar(c)
    plt.show()
[6]:
plot(scale)
[7]:
scale = auto_scale(var, nmax=11)
scale
[7]:
array([11., 12., 13., 14., 15., 16., 17., 18.])
[8]:
scale_n19 = auto_scale(var, nmax=19)
scale_n19
[8]:
array([11. , 11.5, 12. , 12.5, 13. , 13.5, 14. , 14.5, 15. , 15.5, 16. ,
       16.5, 17. , 17.5])
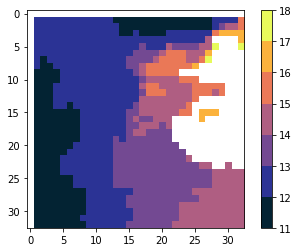
[9]:
plot(scale_n19)
The colorbar separators flatten the histogram of the data
Get the range
[10]:
scalehist = auto_scale(var, nmax=12, flathisto=True, **{"show": False})
scalehist
[10]:
array([11., 12., 13., 14., 15., 16., 17.])
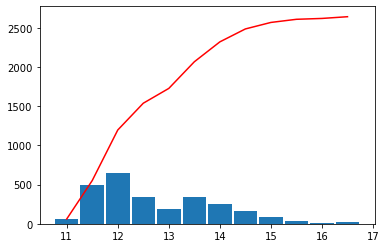
[11]:
scalehist = auto_scale(var, nmax=20, flathisto=True, **{"show": True})
scalehist
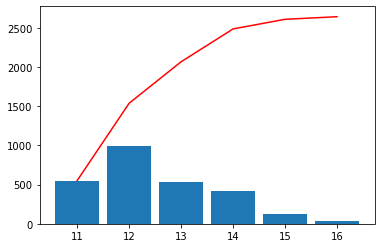


[11]:
array([11.  , 11.5 , 11.75, 12.  , 12.25, 12.5 , 12.75, 13.  , 13.25,
       13.5 , 13.75, 14.  , 14.25, 14.5 , 14.75, 15.  , 15.5 , 16.  ,
       17.  ])
[12]:
len(scalehist)
[12]:
19
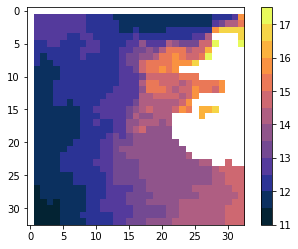
[13]:
plot(scalehist)
The scale without flattening the histogram differs although we ask for the same number of separators and the same bounds
[14]:
scale_n19 = auto_scale(var, nmax=19)
scale_n19
[14]:
array([11. , 11.5, 12. , 12.5, 13. , 13.5, 14. , 14.5, 15. , 15.5, 16. ,
       16.5, 17. , 17.5])
[15]:
scale_n19 = auto_scale(var, nmax=19, vmin=11, vmax=17)
scale_n19
[15]:
array([11. , 11.5, 12. , 12.5, 13. , 13.5, 14. , 14.5, 15. , 15.5, 16. ,
       16.5, 17. ])
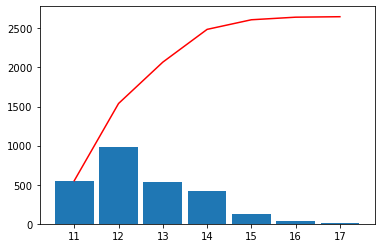
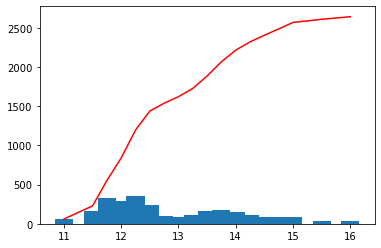
Check the repartition of the values
[16]:
hist, bins = histo(var, bins=scalehist, show=True)

[17]:
hist, bins = histo(var, bins=scale_n19, show=True)